あまりに暑い日が続くので、はたして我が家の1日の温度がどのようになっているのか、グラフにして見てみたいと思い立ちました。
Arduinoエントリーキットを買った時に入っていた温度センサーが未使用で残っていたので、これを使って温度を測定することにしました。
測定した温度は、ESPr Developer でWebサーバに送信し、Webブラウザでグラフを表示できるようにしたいと思います。
作成したのは以下の4つです。
- ハードウエア
- ESPr Developer用のスケッチ
- 温度情報を受信するPHPプログラム
- グラフを表示するPHPプログラム
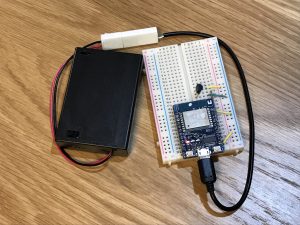
ハードウエア
ハードウエアは非常に簡単で、温度センサ(LM35DZ)とESPr Developerの以下の端子同士を接続するだけです。
| LM35DZ | ESPr Developer |
|---|---|
| 5V | VOUT |
| OUT | TOUT |
| GND | GND |
ESPr Developer用のスケッチ
ESPr Developerでは1分毎に温度を測定し、サーバに送信します。
スケッチは以下のとおりで、そこそこ長いですが、「Arduino→ファイル→スケッチ例→ESP8266WiFi→WiFiClient」のサンプルスケッチを、ほんの数行編集しただけです。
#include <ESP8266WiFi.h>

const char* ssid = "xxxxxxxx";
const char* password = "xxxxxxxx";
char host[40] = "xxxxxxxx";
char event[40] = "/temp_receive.php";

extern "C" {
  #include "user_interface.h" // ESPr Developerでアナログデータを入力する際に記述
}

void setup() {
  Serial.begin(115200);
  delay(10);

  Serial.println();
  Serial.println();
  Serial.print("Connecting to ");
  Serial.println(ssid);

  WiFi.mode(WIFI_STA);
  WiFi.begin(ssid, password);

  while (WiFi.status() != WL_CONNECTED) {
    delay(500);
    Serial.print(".");
  }

  Serial.println("");
  Serial.println("WiFi connected");
  Serial.println("IP address: ");
  Serial.println(WiFi.localIP());
}

void loop() {
  int sensorValue = system_adc_read(); // アナログ値を採取(TOUT端子)
  Serial.println(sensorValue);

  Serial.print("connecting to ");
  Serial.println(host);

  // Use WiFiClient class to create TCP connections
  WiFiClient client;
  const int httpPort = 80;
  if (!client.connect(host, httpPort)) {
    Serial.println("connection failed");
    return;
  }

  // We now create a URI for the request
  String url = String(event) + "?val0=" + String(sensorValue); // 採取したアナログ値を「val0」という変数名で送信
  Serial.print("Requesting URL: ");
  Serial.println(url);

  // This will send the request to the server
  client.print(String("GET ") + url + " HTTP/1.1\r\n" + "Host: " + host + "\r\n" + "Connection: close\r\n\r\n");
  unsigned long timeout = millis();
  while (client.available() == 0) {
    if (millis() - timeout > 5000) {
      Serial.println(">>> Client Timeout !");
      client.stop();
      return;
    }
  }

  // Read all the lines of the reply from server and print them to Serial
  while(client.available()){
    String line = client.readStringUntil('\r');
    Serial.print(line);
  }

  Serial.println();
  Serial.println("closing connection");

  delay(60000); // 60秒待つ
}
温度情報を受信するPHPプログラム
サーバ側で温度情報を受信するPHPプログラム(temp_receive.php)は以下のとおりです。
SQLite3データベースに時間と温度を格納していきます。
<?php
// 各種初期設定
date_default_timezone_set('Asia/Tokyo');

$dbname = 'db_temp';
$db = new SQLite3($dbname);

// tableを作成
$sql = "CREATE TABLE IF NOT EXISTS temp ( id INTEGER PRIMARY KEY, event_time INTEGER, val0 INTEGER )";
$db->exec($sql);

// 現在時刻を取得
$event_time = time();

// デバイス採取値を取得
$val0 = $_GET['val0'];

// 値を書き込み
$sql = "INSERT INTO temp (id, event_time, val0) VALUES(null, $event_time, $val0)";
$db->exec($sql);

$db->close();
?>
グラフを表示するPHPプログラム
貯めたデータをグラフ表示するPHPプログラム(temp_graph.php)は以下のとおりです。とりあえず、グラフを閲覧したその日、一日分の観測データを取り出して、一日分のデータをグラフにしようと思います。
グラフ表示するために、「Chart.js」というものを使います。
<?php
// 各種初期設定
date_default_timezone_set('Asia/Tokyo');

$dbname = 'db_temp';
$db = new SQLite3($dbname);

$res = "";

$now = time();
$btime = strtotime( date("Y/m/d 00:00:00", $now) );
$etime = strtotime( date("Y/m/d 00:00:00", strtotime('+1 day', $now)) );
$date = date("n/j", $now);

// tempテーブルから今日の情報を抽出
$sql = "SELECT * FROM temp WHERE event_time BETWEEN $btime AND $etime";
$result2 = $db->query($sql);

while($info2 = $result2->fetchArray(SQLITE3_ASSOC)){
  $event_time = ($info2['event_time']-$btime)/3600;
  $val0 = $info2['val0']*100/1024;
  $res .= "{ x: " .$event_time .", y: " .$val0 ." },";
}

$db->close();
?>

<!DOCTYPE html>
<html lang="ja">
<head>
<meta charset="utf-8">
<title>温度計</title>
<script src="https://cdnjs.cloudflare.com/ajax/libs/Chart.js/2.7.2/Chart.bundle.js"></script>
</head>
<body>
<h1><?php echo $date;?></h1>
<canvas id="temp" width="300" height="50"></canvas>
<script>
var ctx = document.getElementById('temp').getContext('2d');
var temp = new Chart(ctx, {
  type: 'line',
  data: {
    datasets: [{
      label: 'temperature',
      fill: false,
      borderColor: 'limegreen',
      pointRadius: 0,
      data: [ <?php echo $res;?> ]
    }]
  },
  options: {
    scales: {
      xAxes: [{
        type: 'linear',
        position: 'bottom',
        ticks: { min: 0, max: 24, stepSize: 3 }
      }],
      yAxes: [{
        ticks: { min: 0, max: 50, stepsize: 10 }
      }]
    },
    legend: { display: false, }
  }
});
</script>
</body>
</html>
ふたつのPHPプログラムはWebサーバにアップロードします。
WebブラウザでWebサーバ上の「temp_graph.php」にアクセスすると、温度のグラフが表示されます。
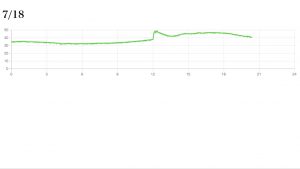
ハードウエアを当社(兵庫県)の南西向きベランダの床面近くに置いた時の結果です。温度の確からしさは未確認ですが、実際の温度も、大体こんなものだと思います。
エアコンの室外機などもあるので過酷な環境ですが、それにしてもシャレにならない気温です。
ハードウエアを冷蔵庫の中に入れても温度を確認できました。冷蔵庫の中でもWiFiが繋がるのが驚きでした。